HAMi AI Platform Online Deployment Guide
This guide is intended for SREs and platform engineers. It explains how to deploy HAMi AI Platform on a Kubernetes cluster, integrate it with foundational components such as HAMi, Prometheus, NVIDIA GPU Operator, and Gateway API, and verify that the deployment works as expected.
⚠️ Installation ≠ Activation
After installing the Helm charts described in this guide, the HAMi AI Platform components will be running. However, the underlying GPU virtualization and scheduling features require an activated license before they can be used .
Installation itself does not require a license. Complete the software deployment first, then apply for and import the license.
Without activation, vGPU partitioning and scheduling are unavailable, and functional verification will fail.
Prerequisite Checks
-
Kubernetes version 1.24 or later, with working
kubectland Helm on the administration host. -
NVIDIA nodes already have the NVIDIA driver and NVIDIA Container Toolkit, or NVIDIA GPU Operator will install them.
-
Ascend nodes already have the vendor driver and runtime configured and are visible to Kubernetes. This guide installs only the HAMi Ascend device plugin.
-
When NVIDIA GPU Operator is used, its default device plugin must be disabled to avoid a conflict with HAMi.
kubectl cluster-info
kubectl get nodes -o wide
helm version
Online Installation
Before running the commands below, confirm that the current kubeconfig context points to the target cluster. Keep the values file for each Chart under version control. Contact Dynamia.ai technical support for access to commercial Charts, mainland China image registries, and production values.
Install NVIDIA GPU Operator (NVIDIA Nodes Only)
If GPU Operator is already installed, do not install it again, and confirm that devicePlugin.enabled=false. GPU Operator 25.10 and later enable CDI by default. The example below explicitly sets cdi.enabled=false to keep this deployment path in non-CDI mode. To use CDI, remove that setting and complete the HAMi-side configuration in Enable NVIDIA CDI support for HAMi before installing or upgrading HAMi. This guide does not duplicate those parameters or verification steps. cdi.default is deprecated and ignored in GPU Operator 25.10 and later.
helm repo add nvidia https://helm.ngc.nvidia.com/nvidia && helm repo update

helm install --wait --generate-name \
  -n gpu-operator --create-namespace \
  nvidia/gpu-operator \
  --set devicePlugin.enabled=false \
  --set dcgmExporter.serviceMonitor.enabled=true \
  --set cdi.enabled=false \
  --version=v25.10.1
Install the Monitoring Stack (When Needed)
If the cluster does not already have Prometheus or a compatible monitoring system and metrics collection is required, install kube-prometheus-stack.
helm install prometheus \
  oci://ghcr.io/prometheus-community/charts/kube-prometheus-stack \
  --version 72.3.0 \
  --namespace monitoring \
  --create-namespace \
  --set alertmanager.enabled=false \
  --set grafana.enabled=false
Install HAMi Enterprise
helm install hami \
  oci://dynamia-ai-registry.cn-hangzhou.cr.aliyuncs.com/public/charts/hami-enterprise \
  --version 2.9.0-r3 \
  --namespace hami-system \
  --create-namespace
See the HAMi Helm Chart Values Reference for the complete configuration.
In addition to HAMi, HAMi AI Platform uses Kubernetes Gateway API with Envoy Gateway as its default service exposure mechanism. If the cluster does not already provide Gateway API resources , check with kubectl api-resources | grep gateway.networking.k8s.io/v1, then install the Gateway API standard channel before continuing.
If the cluster does not already have a Gateway API controller, install envoyproxy/envoy-gateway to expose services:
helm install eg \
  oci://docker.io/envoyproxy/gateway-helm \
  --version v1.6.2 \
  --namespace envoy-gateway-system \
  --create-namespace \
  --set global.images.envoyGateway.image=docker.io/envoyproxy/gateway:v1.6.2 \
  --set global.image.ratelimit.image=docker.io/envoyproxy/ratelimit:99d85510 \
  --set config.envoyGateway.gateway.controllerName=gateway.envoyproxy.io/gatewayclass-controller \
  --set config.envoyGateway.provider.type=Kubernetes
Install dynamia-ai/kantaloupe, the HAMi AI Platform service (referred to as kantaloupe below):
helm install kantaloupe \
  oci://dynamia-ai-registry.cn-hangzhou.cr.aliyuncs.com/public/charts/kantaloupe-chart \
  --version 0.20.1 \
  --namespace kantaloupe-system \
  --create-namespace \
  --set fullnameOverride=kantaloupe
kantaloupe provides settings for feature flags, service exposure, and monitoring integration. Configure them as required. For the complete values reference, see kantaloupe Helm Chart Values Reference.
Common values snippets are shown below. Combine the required snippets to create a complete values file:
- Configure default platform administrator credentials
auth:
  jwtSecret: "your-own-jwt-secret"
  bootstrapAdminUsername: "bootstrap-platform-admin"
  bootstrapAdminPassword: "admin12345"
  bootstrapAdminFullName: "Platform Administrator"
  bootstrapAdminEmail: "admin@email.com"
- Expose Envoy Gateway through a NodePort Service and use an external load balancer (cloud-managed or self-managed) to forward Layer 4 traffic .
gateway:
  enabled: true
  hostnames:
    - your-domain.example.com
  apiserverCors:
    enabled: true
    allowCredentials: true
    allowOrigins:
      - https://your-domain.example.com
  envoy:
    service:
      ports:
        http:
          nodePort: 30080
        https:
          nodePort: 30443
      type: NodePort
  listeners:
    - name: http
      port: 80
      protocol: HTTP
    - name: https
      port: 443
      protocol: HTTPS
      tls:
        certificateRef:
          name: your-domain-tls-secret
        redirectFromHttp: true
- Use Envoy Gateway with a NodePort Service for a simple PoC
gateway:
  enabled: true
  listeners:
    - name: http
      port: 80
      protocol: HTTP
  envoy:
    service:
      type: NodePort
      ports:
        http:
          nodePort: 30080
- Use a LoadBalancer Service managed by a cloud provider or bare-metal load balancer controller
gateway:
  enabled: true
  hostnames:
    - your.domain
  listeners:
    - name: http
      port: 80
      protocol: HTTP
    - name: https
      port: 443
      protocol: HTTPS
      tls:
        certificateRef:
          name: your-tls-secret
        redirectFromHttp: true
  envoy:
    service:
      type: LoadBalancer
      ports:
        http: {}
        https: {}
- Override the Prometheus Query API address (default:
http://prometheus-kube-prometheus-prometheus.monitoring.svc.cluster.local:9090)
apiserver:
  prometheusAddr: http://your-prometheus-query-api.com:9090

controllerManager:
  prometheusAddr: http://your-prometheus-query-api.com:9090
Install the Ascend Device Plugin (Ascend Nodes Only)
Complete the HAMi installation before this step. The following configuration reuses hami-scheduler-device so that multiple Charts do not manage the same device configuration.
nameOverride: "ascend-device-plugin"
fullnameOverride: "ascend-device-plugin"

image:
  repository: dynamia-ai-registry.cn-hangzhou.cr.aliyuncs.com/public/dynamia-ai/ascend-device-plugin
  tag: "v1.3.0"
  pullPolicy: IfNotPresent

config:
  create: false
  existingDeviceConfigMapName: hami-scheduler-device
helm install ascend-device-plugin \
  oci://dynamia-ai-registry.cn-hangzhou.cr.aliyuncs.com/public/dynamia-ai/charts/ascend-device-plugin \
  --version 0.1.1 \
  --namespace hami-system \
  -f ascend-device-plugin.yaml
Enable GPU Nodes
HAMi device-plugin starts only on nodes labeled gpu=on. Run the following command for every GPU or Ascend node that HAMi should manage:
kubectl label nodes <node-name> gpu=on
Nodes and Monitoring
kubectl describe node <node-name>
kubectl api-resources --api-group=monitoring.coreos.com
When Prometheus is used, the ServiceMonitor labels must match Prometheus.spec.serviceMonitorSelector. When VictoriaMetrics is used, the labels must match VMServiceScrape.spec.serviceScrapeSelector.
Query the following NVIDIA metrics in the monitoring system and confirm that the results are not empty:
-
DCGM_FI_DEV_GPU_UTIL -
HostCoreUtilization -
GPUDeviceCoreAllocated
In addition to exporter metrics, you also need to query kantaloupe_gpu_temp to verify that Kantaloupe service metrics are collected correctly.
License Acquisition
Complete the installation and ensure that all component Pods are running normally before starting the activation process.
Use either method below to obtain the license request information. If the HAMi AI Platform site is not yet accessible, use the collection script.
Use HAMi AI Platform
-
Sign in to HAMi AI Platform with a platform administrator account.
-
Open License and System Information .
-
Follow the instructions on the page to obtain the license request information.
Run the Collection Script
The collection script requires kubectl and jq:
# Download and run the script
curl -fsSL https://public.hami.run/collect-hami-license-info.sh | bash

# Run a local copy provided with the delivery materials
bash collect-hami-license-info.sh
The command outputs JSON in the following format:
{
  "esn": "96565d61-986a-4918-aafb-448ff6e3746b",
  "deviceInstances": [
    {
      "uuid": "GPU-ceee905d-48ac-93de-a81b-17c00e1e5e02",
      "deviceType": "NVIDIA A10"
    }
  ]
}
Send the license request information to Dynamia.ai sales, pre-sales, or delivery personnel, then complete activation as instructed.
Post-Activation Verification
# 1. Check Pod status
kubectl -n hami-system get pods

# 2. Check GPU resources registered by the device plugin
kubectl describe node <gpu-node> | grep -A 5 "Capacity:"
# Expected: nvidia.com/gpu: <N> and nvidia.com/gpumem: <MB>

# 3. Check license events generated by the scheduler
kubectl get events --field-selector involvedObject.name=hami-license -n hami-system
Expected: all HAMi Pods are running, GPU resources are registered on GPU nodes, and the hami-license event reports that the license was validated successfully. Then open License and System Information in HAMi AI Platform and confirm that the license status and scope are correct.
HAMi AI Platform Verification
# 1. Pod Status
kubectl -n kantaloupe-system get pods

# 2. Service Accessibility
kubectl -n kantaloupe-system get svc
After the HAMi AI Platform service is exposed, open the site and confirm that the frontend and backend are working normally.
Create Workload
On the console Workload page, create an application (e.g., gpu-burn):
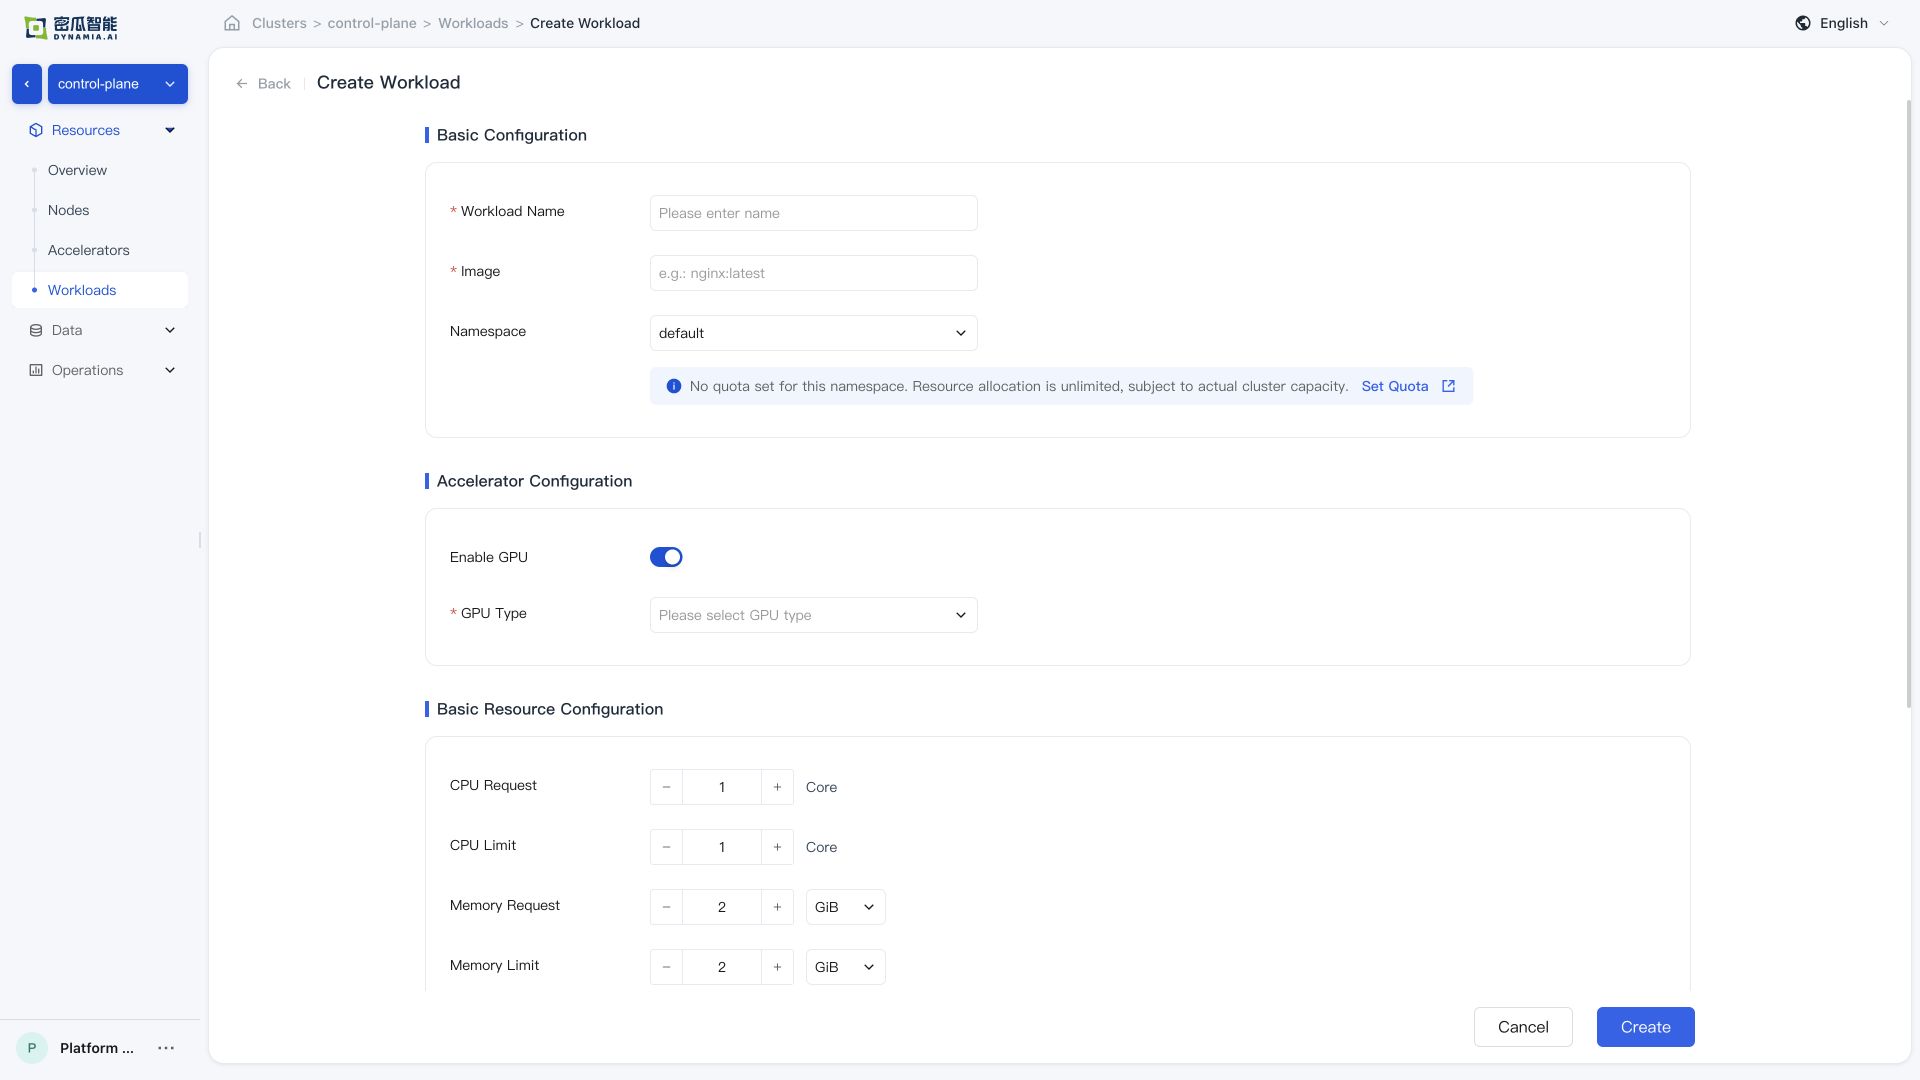
After creation, confirm that the following verification items all pass:
-
Creation successful , no errors in the console
-
Workload list : application status, search, list metrics, and monitoring panels (GPU SM / GPU MEM / CPU / Memory) are normal; time switching and charts meet expectations
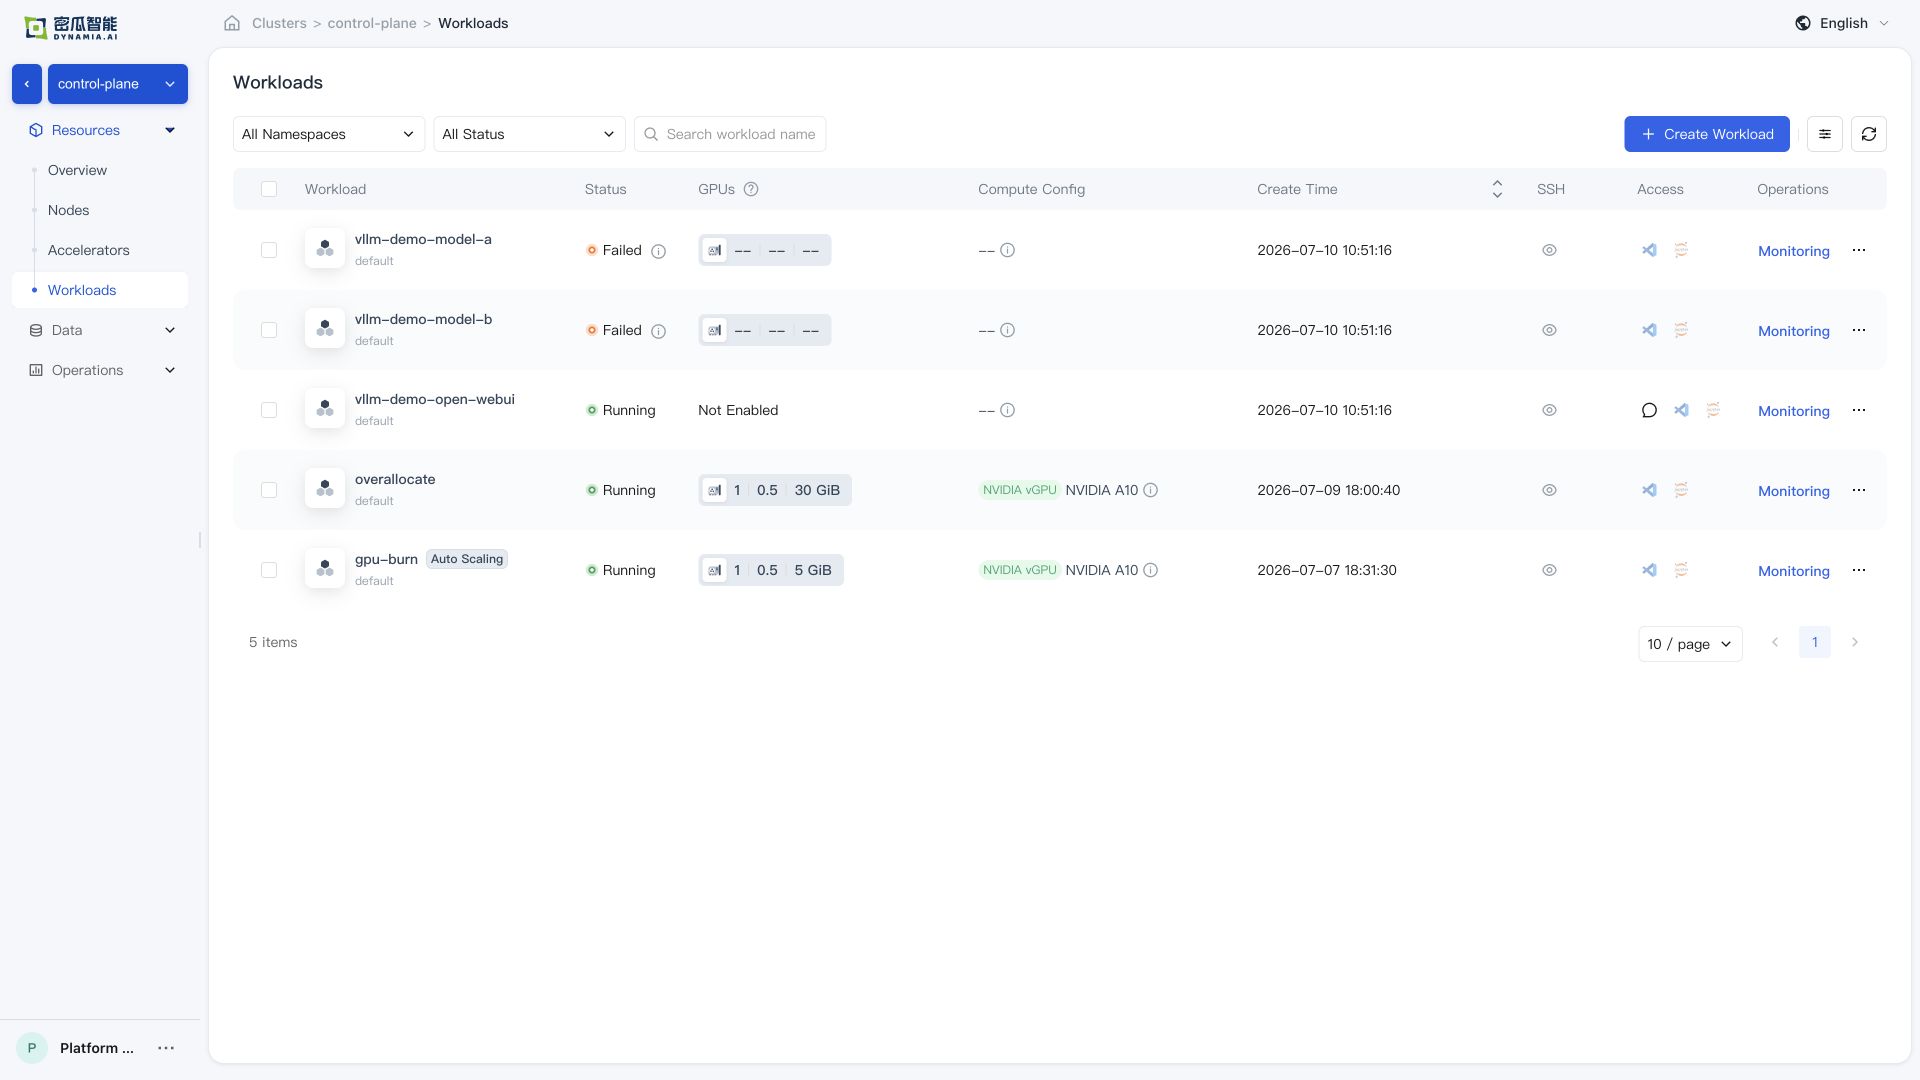
- Application details : basic information, resource overview, and monitoring data are normal; navigating from the detail page to the GPU / Node page, resource overview and monitoring data are normal
Online Sample Workload Verification
Before running this example, confirm that the target cluster can pull nvidia/cuda:12.4.0-base-ubuntu22.04. If the cluster uses a private registry, mirror the image first and update the image reference in the example.
kubectl delete pod hami-smoke --ignore-not-found

kubectl apply -f - <<'EOF'
apiVersion: v1
kind: Pod
metadata:
  name: hami-smoke
spec:
  restartPolicy: Never
  containers:
    - name: cuda
      image: nvidia/cuda:12.4.0-base-ubuntu22.04
      command: ["sh", "-c", "nvidia-smi && sleep 30"]
      resources:
        limits:
          nvidia.com/gpu: 1
          nvidia.com/gpumem: 2000
EOF

kubectl wait --for=condition=Ready pod/hami-smoke --timeout=180s
kubectl logs hami-smoke
If the Pod reaches Ready and the logs show GPU information, HAMi has scheduled the GPU and the NVIDIA runtime is available inside the container. Delete the test Pod after verification.
kubectl delete pod hami-smoke
Common Issues
| Symptom | Possible Cause | Resolution |
|---|---|---|
| Image pull fails | The node cannot reach the image registry, registry authentication is missing or invalid, or the image reference is incorrect | Inspect the Pod events and image reference, verify node DNS and network access to the registry, and configure the required image pull credentials. |
hami-device-plugin Pod is Pending or missing | The node is not labeled gpu=on | kubectl label nodes <node> gpu=on |
hami-device-plugin Pod is in CrashLoopBackOff | It conflicts with the default NVIDIA device-plugin | Disable the GPU Operator devicePlugin (--set devicePlugin.enabled=false). |
| HAMi metrics are unavailable | The serviceMonitorSelector of the Prometheus resource does not match the labels on the ServiceMonitor resource | Align prometheus/prometheus-kube-prometheus-prometheus spec.serviceMonitorSelector with the labels configured for the HAMi ServiceMonitor. |
nvidia-smi reports an error | The GPU driver is not ready | Check the driver Pod status in the gpu-operator Namespace. |
Sample workload remains Pending | The license is not activated, GPU capacity is insufficient, or node labels are missing | Check the license, GPU node labels, and kubectl describe pod events. |
Gateway has no ingress address | Gateway API or Envoy Gateway CRDs are not ready, the Envoy Gateway release is unhealthy, or the Envoy Service type is unsuitable for the cluster | Check the Established status of all 20 related CRDs, run helm status eg -n envoy-gateway-system, and inspect the Gateway conditions and Envoy Service. Do not retry by uninstalling the CRD release or deleting CRDs. |
Support
-
Email: info@dynamia.ai
-
Sales / technical support: 400-026-7800
-
Customers with active commercial agreements should submit support requests through their dedicated support channel.